Salesforce Org Health and Monitoring
In the Fundamentals chapters we covered the platform foundations: orgs and editions, users and permissions, the data model, and your first steps with automation and reporting. With that grounding in place, the focus now shifts from understanding Salesforce to keeping it healthy, stable, and safe to change. Org health is the practice of checking an org’s security settings, configuration changes, user activity, capacity, and automation on a schedule, so that problems surface before users report them.
Org health and monitoring is where good admin work starts to show. When an org is well watched, security gaps are spotted earlier, technical debt is easier to manage, releases land more cleanly, and users spend less time dealing with avoidable friction. In this article, you’ll learn how to run a proper org health check: assess your security posture, investigate configuration and record changes, review login activity, track storage and API consumption, and catch failing jobs and automation errors before they become incidents. A well-monitored org makes every improvement that follows easier to deliver and far less risky.
🤔 Why Org Health Matters
Section titled “🤔 Why Org Health Matters”When you start with an existing Salesforce org, whether as a new admin, a developer, or a consultant, you inherit everything that came before you. Every unused field, every overlapping permission set, every “temporary” automation that quietly became permanent. A well maintained org is a pleasure to work in: changes behave predictably, deployments succeed, and users trust the data. A neglected one is the opposite.
Org health affects everyone on the platform. Redundant metadata clutters the UI and slows down the system. Poorly designed automation creates conflicts that are difficult to diagnose. Storage limits tend to surface at the worst possible moment. Security gaps introduce risks that are far more expensive to fix after something goes wrong.
Monitoring isn’t just housekeeping: it’s how you stay ahead of problems instead of reacting to them. The tools in this section take minutes to run and can reveal issues that would otherwise take hours to debug. Building a habit of regular review is one of the simplest and most valuable practices you can adopt, whatever your role.
The mindset shift: Great Salesforce professionals don’t wait for users to report problems. They check proactively, catch drift early, and keep the org in a state where everyone can do their best work.
🔐 Check the security posture
Section titled “🔐 Check the security posture”🔒 Security Health Check
Section titled “🔒 Security Health Check”Security Health Check is Salesforce’s built‑in security dashboard that gives you an instant snapshot of how your org’s configuration measures up against a defined security baseline. It produces a score from 0–100, groups your settings by risk level, and shows exactly where your org deviates from best practice.
Navigate to: Setup → Quick Find → Health Check
It works by comparing your org’s active settings against a baseline; either the Salesforce Baseline Standard (Salesforce’s recommended configuration) or a custom baseline your organisation defines to meet specific compliance or industry requirements. Because the score depends on the chosen baseline, only compare scores when the same baseline is in use.
Health Check then produces a prioritised list of settings that need attention, grouped into four risk categories:
- High — Significant security exposure; address promptly
- Medium— Deviates from best practice; lower immediate risk
- Low — Minor deviations to review over time
- Informational — Does not affect the score but still worth noting
What Health Check Actually Tells You
Section titled “What Health Check Actually Tells You”For each security control such as password policies, session timeouts, clickjack protection, Transport Layer Security (TLS) version requirements, and API access settings, Health Check shows your current org value, the baseline value, and whether the difference is considered a risk. This makes it easy to understand not just what is flagged, but why.
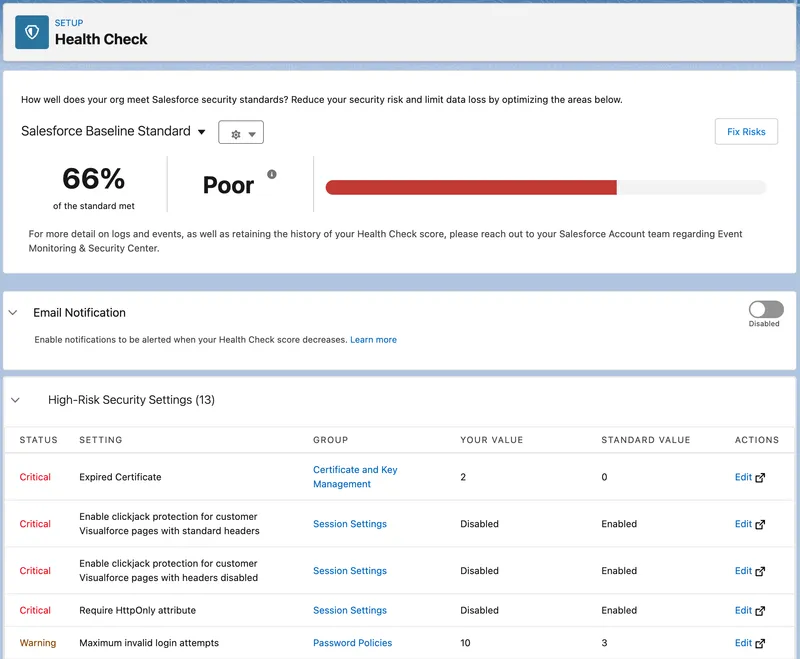
At a glance, you can see:
- Overall score — a numeric measure of alignment with the chosen baseline
- Risk severity counts — how many High, Medium, and Low items exist
- Per‑setting detail — current value vs recommended value for every evaluated control
- Fix Risks shortcut — a one‑click option to apply baseline values automatically across multiple settings
Use Fix Risks with caution. It’s convenient, but applying baseline values automatically can change session timeout lengths, password policies, and other settings that affect every user in your org. Always review changes in a sandbox first before applying them in production.
How to Run Health Check Safely
Section titled “How to Run Health Check Safely”Running Health Check is simple; the real value comes from applying its recommendations in a controlled, predictable way. These steps give you a safe, repeatable process that avoids surprises and keeps your org stable.
-
Start in a Sandbox
Health Check itself is harmless to view, but changing settings can impact users and integrations. Reviewing everything in a sandbox first gives you room to experiment and learn before making decisions that affect the live environment. -
Capture a baseline. Before adjusting anything, record your starting point by exporting the Health Check CSV, taking a screenshot of the overall score, and noting which baseline is being used. This gives you a clear reference for audits, rollback, and tracking improvements over time.
-
Prioritise high‑risk items. Not every finding needs immediate attention. High‑risk items are the ones that meaningfully strengthen your security posture, so they’re the best place to start. Medium‑risk items can follow, while low‑risk and informational items can be reviewed when time allows.
-
Review each setting carefully. Even recommended changes can alter behaviour. Some settings affect session lengths, password resets, or login requirements; others influence integrations through API access or TLS requirements. It’s also worth checking whether your organisation has compliance rules that intentionally differ from Salesforce’s defaults. Understanding the impact of each change is key to avoiding surprises.
-
Treat “Fix Risks” with caution. Fix Risks can apply multiple recommended settings at once, which is convenient but potentially disruptive. It can shorten session timeouts, enforce stricter password policies, change clickjack protection, or modify API and TLS requirements. Always test these changes in a sandbox and apply them individually in production so you can monitor their impact.
-
Roll out changes gradually in production. Once you’ve validated the adjustments, apply the most important fixes first, communicate anything that affects users, and make changes during low‑impact windows. After each batch, re‑run Health Check to confirm that the score and risk profile have improved as expected.
-
Make it a routine. A monthly quick scan and a deeper quarterly review help you catch drift early and keep your org secure, predictable, and easy to build on.
🔍 Org Check
Section titled “🔍 Org Check”Org Check is an open-source tool from Salesforce Labs, available through the AppExchange, that gives you an interactive view of the technical debt that naturally builds up in any busy org. It runs inside your org and analyses unused metadata, overlapping permissions, redundant configuration, and structural complexity, with drill-down detail behind each finding.
What Org Check Analyses
Section titled “What Org Check Analyses”Org Check evaluates four broad areas of your org:
Data Model
Section titled “Data Model”This looks across every standard and custom object, including the related fields, page layouts, record types, and validation rules. It flags unused or redundant metadata that is cluttering your schema.
Automation
Section titled “Automation”This reviews the flows in your org, highlights active versus inactive automation, and surfaces complexity that may affect performance. It also identifies any remaining Workflow Rules or Process Builder automation, which makes legacy areas easier to spot and plan for migration.
User Interface
Section titled “User Interface”This analyses Lightning pages, components, layouts, tabs, and custom apps. It identifies page layouts that exist but are never assigned, and highlights Lightning pages with unused or redundant components so you can keep the UI lean and maintainable as the org grows.
Users & Permissions
Section titled “Users & Permissions”This is the most detailed section. For active internal users it shows which critical system permissions they hold, including API Enabled, Modify All Data, and View All Data, so over-privileged accounts are easier to spot. Profiles and permission sets are analysed in detail, including assignment status, object permissions, field-level security (FLS), and critical permissions. An object permission matrix shows create, read, update, and delete (CRUD) access, which is simply who can do what to records on each object, for every profile and permission set. A field-level security matrix then lets you drill into any specific object. The role hierarchy is visualised as a dependency tree with colour coding to show which roles have active users and which are empty placeholders ready to be cleaned up.
Org Check vs Health Check
Section titled “Org Check vs Health Check”These tools are complementary, not competing:
| Health Check | Org Check | |
|---|---|---|
| Focus | Security configuration | Technical debt & metadata |
| Source | Native Salesforce (Setup) | Free AppExchange install |
| Output | Security score + risk list | Interactive drill down reports |
| Best for | Security posture review | Structural cleanup & impact analysis |
Run both regularly: Health Check for your security posture, Org Check for the structural condition of the org.
Note: Org Check is a Salesforce Labs product; free, open‑source, and community supported. It is not an official Salesforce product and Salesforce Support is not available for it.
📜 Find out what changed and who changed it
Section titled “📜 Find out what changed and who changed it”📋 Setup Audit Trail
Section titled “📋 Setup Audit Trail”Setup Audit Trail is a native Salesforce tool that records configuration changes made in Setup or deployed into the org. It shows who made the change, what they changed, and when it happened. It’s your primary source of truth for understanding how your org has evolved over time and for investigating unexpected behaviour after a deployment or configuration update.
Navigate here: Setup → Quick Find → View Setup Audit Trail
What It Tracks
Section titled “What It Tracks”Setup Audit Trail captures a wide range of configuration changes. Examples include profile and permission set updates, changes to sharing settings and organization-wide defaults (OWD), flow activations and deactivations, custom field and object creation or deletion, user record changes such as role or profile updates, installed or uninstalled packages, and updates to single sign-on (SSO) or authentication settings.
What You Can See
Section titled “What You Can See”The live view in Setup shows the 20 most recent changes. For a broader picture, you can download the log as a CSV, which provides up to 180 days of change history in a format you can filter, sort, and share.
It’s important to note that Audit Trail is a rolling window, not a permanent archive. Anything older than 180 days is not retained. If your organisation needs long‑term audit history for compliance, you should export and archive the log regularly.
Each entry includes the date and time of the change, the user who made it, the section of Setup where the change occurred, and a plain‑language description of exactly what was changed.
What It Doesn’t Track
Section titled “What It Doesn’t Track”Setup Audit Trail records configuration changes, not data changes. If a user edits a record, that won’t appear here. For field-level data change history on records, use Field History Tracking, which is a related but separate feature.
When to Check It
Section titled “When to Check It”You’ll use Setup Audit Trail most often after deployments, when users report unexpected behaviour, during admin or developer offboarding, and as part of your regular org health review.
🧾 Field History Tracking and Field Audit Trail
Section titled “🧾 Field History Tracking and Field Audit Trail”Setup Audit Trail tells you when the org’s configuration changed. Field History Tracking answers a different operational question: who changed a record field, what its previous and new values were, and when the change happened. This makes it useful for investigating data-quality issues, disputed updates, unexpected automation outcomes, and changes to sensitive business fields.
Navigate here: Setup → Object Manager → select an object → Fields & Relationships → Set History Tracking
Choose fields because their changes carry a real business, security, or compliance risk. Once tracking is enabled, Salesforce exposes the captured changes through the record’s history related list and an object-specific history object. A focused SOQL query is useful when you need to search or order that evidence directly:
SELECT Field, OldValue, NewValue, CreatedDate, CreatedByIdFROM OpportunityFieldHistoryWHERE Field = 'StageName'ORDER BY CreatedDate DESCThis query only returns history Salesforce has captured for the enabled field. History objects are read-only, and not every field type supports tracking.
Choosing the right history option
Section titled “Choosing the right history option”Standard Field History Tracking is usually enough for recent operational investigation. Salesforce Shield Field Audit Trail is the stronger fit when the organisation needs to track more fields, retain evidence for longer, or apply a formal retention policy.
| Decision | Field History Tracking | Shield Field Audit Trail |
|---|---|---|
| Fields per object | Up to 20 | Up to 200 |
| Retention | 18 months in Salesforce and up to 24 months through the API | Retained until deliberately deleted |
| Storage lifecycle | Stored in an object-specific history object, such as OpportunityFieldHistory |
Initially recorded in the same history object, then copied to FieldHistoryArchive according to the retention policy |
| Access | Available through the record history UI and API | Recent history remains available through the normal history interfaces; archived history is available through supported APIs and Shield tools such as Field History Explorer |
| Best fit | Troubleshooting and recent operational evidence | Long-term governance, regulated retention, and forensic investigation |
Field Audit Trail is available in supported Enterprise, Performance, and Unlimited orgs through Salesforce Shield or a Field Audit Trail licence. It builds on Field History Tracking rather than replacing its setup: first enable tracking for the required objects and fields, then deploy a HistoryRetentionPolicy through the Metadata API. By default, eligible history is archived after 18 months in production or one month in a sandbox, and the archived data remains until it is deliberately deleted.
Archived history can be queried from FieldHistoryArchive. Shield’s Field History Explorer also provides a UI for filtering retained changes by criteria such as user, field, and date, then downloading the results for further investigation.
When to check it
Section titled “When to check it”Review field history when a record value is disputed, an automation result no longer makes sense, sensitive data changes unexpectedly, or an incident requires a timeline of who changed what. Review the tracking configuration itself when business processes, regulated fields, or retention obligations change.
👤 Login History & User Monitoring
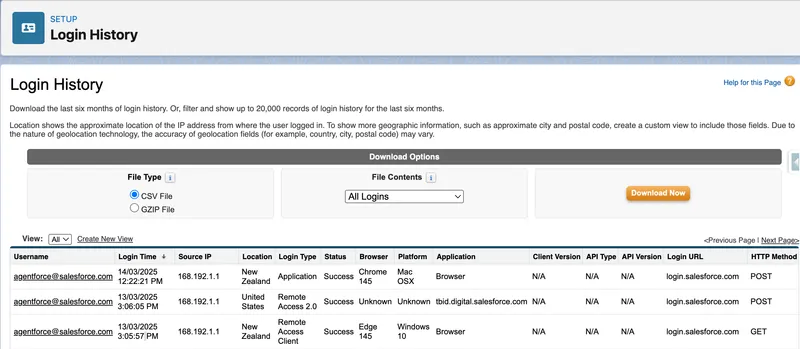
Section titled “👤 Login History & User Monitoring”Login History is a native Salesforce tool that records every login attempt to your org, whether it succeeds or fails. It shows who tried to log in, when, from where, and how. In any org with real users and real data, reviewing login activity regularly is a simple but important security and administration habit.
Navigate here: Setup → Quick Find → Login History
What It Tracks
Section titled “What It Tracks”Each entry shows the username, whether the login succeeded or failed, the date and time of the attempt, the originating IP address, the login type (username/password, single sign-on, API, or Lightning), and the client used (browser, Salesforce mobile app, Data Loader, or another tool). Failed attempts include a plain language status such as Invalid Password or IP Restricted.
If you only need to review activity for a specific user, you can also access their individual login history directly from their User record.
What to Look For
Section titled “What to Look For”Login History becomes far more useful once you know the patterns worth paying attention to. A sudden spike in failed login attempts for a single user may indicate a brute‑force attempt or simply a locked‑out user who needs help. Logins from unfamiliar IP addresses or unexpected regions are worth investigating, especially for admin accounts. API or Data Loader logins from users who shouldn’t be performing bulk operations are another signal to follow up on.
Limitations to Know
Section titled “Limitations to Know”Login History retains data for six months. It’s a rolling window, not a permanent archive. If your organisation has compliance requirements around access logging, export and archive the data regularly.
Login History also only shows authentication events. It tells you someone logged in, not what they did once inside. For a fuller picture of user activity, Login History works alongside Event Monitoring, an additional licensed feature that captures page views, report exports, API calls, and more.
When to Check It
Section titled “When to Check It”Check Login History after a security incident or suspected unauthorised access, when deactivating a user to confirm their last login and whether active sessions need clearing, during regular org health reviews to identify dormant accounts still consuming licences, and whenever a user reports being locked out so you can quickly see the failed attempts and their source.
🚦 Watch capacity and background work
Section titled “🚦 Watch capacity and background work”📦 Storage & Limits
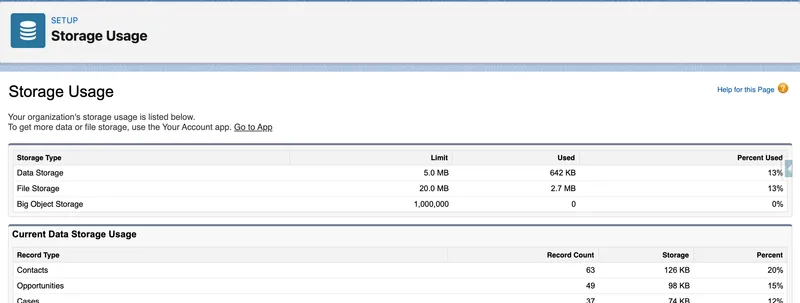
Section titled “📦 Storage & Limits”Salesforce orgs have defined limits on data storage, file storage, and API usage. These limits do not usually announce themselves, and the impact of hitting them varies. A storage limit is a hard stop that prevents record saves and imports outright. API limits are a little less direct in production orgs, where you may see pressure building before a hard cap is enforced. What they share is that none of them give you much warning. Understanding which limits matter and how to monitor them before they become a problem is a core admin responsibility.
Navigate here: Setup → Quick Find → Storage Usage
The Three Limits to Watch
Section titled “The Three Limits to Watch”Data storage
Section titled “Data storage”Measured in MB or GB depending on your edition and is consumed by every record in your org, standard and custom objects alike. Orgs can hit this limit without warning, especially those that have been running for years without archiving or cleanup, or after a large data migration.
Data storage is calculated per record, not per field, so even objects with many empty fields still consume the same storage as records with hundreds of fields filled in. This often surprises teams who assume “lightweight” records take up less space.
For extremely large datasets that don’t need frequent updates, Big Objects provide a separate storage limit from standard objects, giving you a way to retain high‑volume data without consuming your org’s normal data storage allocation. They require developer setup and aren’t a drop‑in replacement for standard objects, but they’re useful for long‑term, queryable storage.
File storage
Section titled “File storage”File storage is separate from data storage and covers attachments, uploaded files, Salesforce Files content, and documents. Large attachments are a common culprit. A single object with a frequently used file upload field can consume storage quickly.
API requests
Section titled “API requests”API requests are counted on a rolling 24-hour basis. Orgs with multiple integrations, scheduled jobs, and heavy automation can approach this limit, especially during busy business periods or after a new integration goes live. Hitting the API limit can cause integrations to fail silently until the window resets.
How to Monitor Storage
Section titled “How to Monitor Storage”The Storage Usage page in Setup gives you a breakdown of data and file storage; total allocation, how much is used, and which objects are consuming the most. It’s worth checking this periodically, and particularly before any large data import or migration.
For API usage, the System Overview page (Setup → Quick Find → System Overview) shows your current API request consumption against your daily limit, along with other org-wide limits such as active flows, scheduled jobs, and custom objects.
Beyond native Setup tools, browser extensions such as Salesforce Inspector and Salesforce Inspector Reloaded surface org limits directly in the browser without forcing you through several Setup menus. Many admins and developers find that more convenient in day-to-day work. These tools display storage consumption, API usage, and other key metrics alongside the org you are already working in.
When Limits Become a Problem
Section titled “When Limits Become a Problem”If you hit data storage limits, your options are archiving old records, deleting records that are no longer needed, or purchasing additional storage.
Before deleting records to free storage, consider whether they should be archived externally for compliance, reporting, or audit requirements. Cleanup is important, but so is retaining the right history in the right place.
If you hit API limits, the fix is usually to review integration call patterns, batch API requests more efficiently, or upgrade your edition. None of those is a quick fix under pressure, which is why proactive monitoring matters.
🔄 Apex Jobs & Scheduled Jobs
Section titled “🔄 Apex Jobs & Scheduled Jobs”Salesforce can run a lot of work in the background: batch processing, scheduled automation, and queued logic that executes outside of user sessions. Because this work happens behind the scenes, failures don’t surface as visible errors to users or admins. A nightly batch job that cleans up records, syncs data, or generates outputs can fail repeatedly without anyone noticing until the downstream effects become obvious.
Navigate here: Setup → Quick Find → Apex Jobs or Scheduled Jobs
Two Pages, Two Purposes
Section titled “Two Pages, Two Purposes”The Apex Jobs page shows every asynchronous Apex process that has run, is running, or is queued. This includes batch jobs, scheduled jobs, and queueable jobs, which are background Apex jobs that run outside the user’s immediate action. It displays status, timing, the number of records processed, and, crucially, error details for anything that has failed or completed with issues.
The Scheduled Jobs page shows all jobs configured to run on a recurring schedule, covering everything from scheduled Apex and flows to dashboard refreshes, reporting snapshots, and scheduled reports. It’s the quickest way to answer “what automated processes are set to run in this org, and when?” without digging through the full Apex Jobs history.
Understanding Job Statuses
Section titled “Understanding Job Statuses”Jobs move through statuses such as Queued, Preparing, Processing, Completed, and Failed. A key detail is that a job can show as Completed even if it encountered errors on individual records. Those errors appear in the Status Details column rather than changing the overall status. Always check Status Details on completed jobs, not just the headline status.
Jobs in a Holding state are sitting in the Apex Flex Queue, which is Salesforce’s waiting area for queued batch work. That is normal under load, but it is worth monitoring if jobs stay there longer than expected.
Error Notifications
Section titled “Error Notifications”Salesforce does not send automatic failure notifications for batch jobs by default, so any alerting must be deliberately set up. You can use Apex Exception Email (Setup → Quick Find → Apex Exception Email) to capture unhandled Apex exceptions org‑wide, or build custom notification logic directly into the batch class.
It is worth confirming this is in place for any business critical scheduled jobs, and that notifications go to someone who can act on them. A related and easily overlooked issue is that scheduled jobs run as the user who originally scheduled them. If that user is deactivated, the job will fail, making staff offboarding a key moment to audit which scheduled automations they owned.
Monitoring Apex jobs is covered in the Asynchronous Apex Trailhead module, but it is very developer focused and assumes a reasonable understanding of Apex code.
🌊 Flow & Process Automation Errors
Section titled “🌊 Flow & Process Automation Errors”As Salesforce Flow takes on more of the automation workload in modern orgs, understanding how and where it fails becomes an increasingly important admin skill. Salesforce sends email notifications for unhandled flow faults to either the person who last modified the flow or the org’s configured Apex Exception Email Recipients. Those destinations are easy to miss or misconfigure. More importantly, a flow with no fault path can stop and surface a generic error to the user, which makes the real cause harder to spot quickly. Proactive monitoring of the Paused and Failed Flow Interviews page gives you visibility that error emails alone do not reliably provide.
Navigate here: Setup → Quick Find → Paused and Failed Flow Interviews
Failed Flow Interviews
Section titled “Failed Flow Interviews”For supported flow types, Salesforce can save an unhandled failure as a failed flow interview. In plain terms, that is a runtime record of what was running and where it went wrong. The Paused and Failed Flow Interviews page lists those saved records, their error messages, and the flow versions that were running. Treat it as a strong lead rather than a complete ledger: saving failed interviews has limits, and in bulk transactions involving Apex Actions, the displayed record details can belong to the first record in the batch rather than the record that caused the failure.
Paused Interviews & Scheduled Actions
Section titled “Paused Interviews & Scheduled Actions”Not everything on this page represents a failure. Paused interviews are flow instances waiting on a resume condition such as a time-based pause element. They are expected, but a large build up on a single flow is worth investigating because it may indicate a condition that is never being met.
Flows that use scheduled paths or time‑based actions also create pending work that sits in a queue until the scheduled time arrives. You can view and manage all of this at Setup → Quick Find → Time‑Based Automations, which provides a unified view of queued automation across flows and any remaining legacy workflow rules. This page is useful for confirming that expected automation is queued and for cancelling pending actions when a record has changed and the automation is no longer relevant.
A Note on Process Builder
Section titled “A Note on Process Builder”Many orgs still have active Process Builder automation running alongside or underneath their flows. Process Builder failures surface in the same Paused and Failed Flow Interviews page, so not every entry you see there will be a flow. This is particularly common in older orgs that haven’t yet completed a migration to Flow‑first automation.
There is a fun and useful module on Flow troubleshooting that focuses on diagnosing and fixing issues inside an individual flow. It’s a good hands-on complement to this section, which takes a broader view by showing you how flow and Process Builder errors surface across the org, how to monitor them, and how to spot patterns that indicate deeper automation problems.
🌐 Rule out the platform
Section titled “🌐 Rule out the platform”📡 Salesforce Trust (When Things Go Wrong)
Section titled “📡 Salesforce Trust (When Things Go Wrong)”When something in your org suddenly behaves differently, perhaps pages are loading slowly, logins are failing, features are timing out, or integrations are dropping requests, the quickest way to check for a known platform-wide issue is Salesforce Trust.
Trust is Salesforce’s real‑time status and incident site, showing active incidents, maintenance windows, degraded performance, and regional disruptions for your specific instance.
Visit: trust.salesforce.com → Search for your instance (e.g., AP28, NA85, EU44)
Trust gives you what you can’t get from inside your org: a live view of your instance’s health, details on any ongoing incidents, and updates directly from Salesforce on progress and resolution timelines. It is the fastest first check for the question every admin hears sooner or later: “Is this us, or is Salesforce having a problem?” A matching incident gives you an answer; no listed incident means you keep investigating rather than treating the platform as ruled out.
🧰 Other Things to Monitor
Section titled “🧰 Other Things to Monitor”Monitoring an org goes beyond the headline tools. There are quieter areas worth knowing about, particularly when inheriting an org or diagnosing an issue with no obvious cause.
🔑 Named Credentials & Remote Site Settings
Section titled “🔑 Named Credentials & Remote Site Settings”These control which external endpoints Salesforce is permitted to communicate with.
Remote Site Settings define the URLs that Salesforce is allowed to make callouts to. If an endpoint URL changes or a new integration is being set up, a missing or incorrect remote site entry will block the callout entirely.
Named Credentials provide a secure way to define callouts by storing the endpoint and its authentication details together. When a Named Credential handles authentication, Salesforce waives the remote site setting requirement for that endpoint.
Legacy Named Credentials store authentication directly in the credential. External Credentials are the newer approach. They separate the authentication protocol and principal details from the Named Credential itself, which makes access easier to manage across multiple users or permission sets. If an integration stops working, it is worth checking whether the underlying External Credential still has valid authentication. If the connection uses OAuth, the sign-in token may need reauthorising, or credentials may have been rotated in the external system.
Navigate here: Setup → Quick Find → Remote Site Settings or Named Credentials
🔏 Certificates
Section titled “🔏 Certificates”These are used to authenticate outbound calls and secure integrations. They have expiry dates, and Salesforce sends email notifications to system administrators at 60, 30, and 10 days before expiry, and again on the day itself. By default, these go to all users with the System Administrator profile or the Modify All Data permission, though you can narrow that down by assigning the Receive Certificate Expiration Notifications permission to specific users.
Keeping an eye on which certificates are in use and when they expire is worth building into your regular org health review, and CA-signed certificates now need it monthly rather than quarterly; the cadence section explains why. An expired certificate can quietly break any integration, SSO configuration, or Connected App that depends on it.
Navigate here: Setup → Quick Find → Certificate and Key Management
This controls whether your org can send outbound emails. It is sometimes set to System Email Only in sandboxes and then accidentally left that way when the org is promoted or cloned. If users or automation are reporting that emails are not being sent, this is one of the first places to check.
Navigate here: Setup → Quick Find → Deliverability
📈 Lightning Usage App
Section titled “📈 Lightning Usage App”The Lightning Usage App provides adoption and performance data, including which pages users visit, how fast they load, and where UI errors are occurring. It is less of a break-fix tool and more useful for identifying performance bottlenecks and understanding how your org is actually being used.
Navigate here: App Launcher → Lightning Usage
📅 Build the monitoring cadence
Section titled “📅 Build the monitoring cadence”Every tool above comes with a “when to check it”. Read one at a time, the checks sound manageable. Read together, they are a list nobody will remember, which is how monitoring quietly turns into something you do after an incident rather than before one. The fix is to decide the rhythm once and write it down, so checking becomes a scheduled habit rather than a judgement you make each week.
A cadence that suits many orgs looks like this. Adjust the frequencies to the org’s size, risk, and rate of change, and keep the checks that match the features it uses. Notifications can raise individual failures, but scheduled review catches missed alerts, repeated faults, and slow drift.
| When | Check | What you are looking for |
|---|---|---|
| Daily, five minutes | Paused and Failed Flow Interviews; Apex Jobs; Trust if anything feels slow | New failures since yesterday, a build-up on one flow, an incident on your instance |
| Weekly | Login History; Storage Usage; System Overview for API requests | Logins from unexpected places or hours; storage and API figures against last week’s entry |
| Monthly | Health Check quick scan; View Setup Audit Trail; Certificate and Key Management | A drifted score, changes you did not know about, a certificate expiring before your next check |
| Quarterly | Full Health Check and Org Check; Named Credentials; Field History Tracking | Decayed settings, credentials due for rotation, tracking that no longer matches your regulated fields |
| After every release | View Setup Audit Trail against the release; Paused and Failed Flow Interviews; Lightning Usage App | Changes that were not in the release, new failures, pages that slowed down |
The weekly row needs one small log. The standard Storage Usage page shows the current position rather than a historical trend, so record the storage and API figures each week and compare them with the previous entry.
Certificates used to be a quarterly item, and the ones you create in Salesforce still could be, because a self-signed certificate lasts a year. Anything signed by a public certificate authority is different now. The CA/Browser Forum is shortening the maximum lifetime in steps: 200 days until 15 March 2027, 100 days from 15 March 2027, and 47 days from 15 March 2029. Those limits apply to every new publicly trusted TLS certificate, regardless of whether you, Salesforce, or a third party buys it. Existing certificates keep their expiry dates; the shorter lifetime applies when a certificate is created or renewed.
At 100 days, a quarterly check can leave barely more than a week to replace the certificate. At 47 days, it can miss an entire certificate lifetime. Move the calendar check to monthly, look for anything that expires before the next check plus the time it takes you to replace it, and treat the check as a backstop rather than the control itself.
Assign the Receive Certificate Expiration Notifications permission to more than one admin, so the 60-, 30-, and 10-day warnings reach people who will act on them. Salesforce sends the final reminders, one day before expiry and again on the day, more broadly, to everyone with the System Administrator profile or Modify All Data. If a certificate you manage serves a custom domain, reduce the manual work: update the domain to use the Salesforce content delivery network (CDN), which is available only for custom domains serving an Experience Cloud site; use a third-party CDN or service that manages the certificate; or automate certificate creation and updates through the Metadata API.
Two things make the table stick. Put the daily and weekly rows somewhere you already look, such as a calendar reminder or the top of a team channel, because a cadence that lives only in a document is a cadence nobody runs. Write down who does each row too, so a holiday does not switch off monitoring for a fortnight without anyone noticing.
Sandbox Strategy & Change Management puts post-deployment steps in a documented runbook; copy the after-every-release row into that runbook so it travels with the release.
🚨 Triage an incident: the worked record
Section titled “🚨 Triage an incident: the worked record”Monitoring tells you something is wrong. Triage is the short stretch between that moment and knowing what to do, and it is where a calm admin and a panicking one part company. The difference is rarely knowledge of the tools. It is having a fixed order: capture the report, check the platform, then write down six things as you work through the org. Record the symptom, its scope, what changed recently, how you contained it, who owns it, and what happens next. That record is the artefact. It is what you hand to whoever fixes the root cause, what you show the business owner, and what turns one bad Monday into a pattern you can see the third time it happens.
Here is the method run through one incident. It is a worked illustration rather than a case study: the shape is what transfers, and the numbers are there to make the sequence legible.
This incident uses the case automation from Build one: a follow-up when a case closes, which you’ll build two chapters from now in Automation; read the walkthrough for the method now, and come back to run it against your own flow once it exists. The follow-up task is created on the immediate after-save path and its Create Records element has a fault path.
-
Capture the report. Monday, 8:40am. A support team lead messages you: “Cases we closed on Friday afternoon haven’t got follow-up tasks. Is the automation broken?” Record who reported it, when, and the words they used. You will separate the symptom from their theory in a moment.
-
Check the platform. Before you open anything in Setup, check Trust for your instance. At 8:42am, there is no matching incident listed. That narrows the search, but it does not prove the cause is inside the org. Continue with the org-side checks, and keep an unreported platform issue open as a possibility. If a core Salesforce problem continues for more than ten minutes without appearing on Trust, contact Salesforce Support.
-
Write down the symptom. Describe only the outward behaviour people can observe: “Cases close successfully, but the expected follow-up tasks do not appear, and users receive no error.” Keep the detection details beside it but separate: first noticed Monday at 8:30am and reported at 8:40am by the support team lead. Friday afternoon is only the earliest affected period mentioned in the report; the scope check will test whether the problem began then and whether it is still happening. Do not turn the symptom into a diagnosis such as “the flow is broken”. You have recorded the effect; the cause still has to be found.
-
Establish the scope. Find out who is affected, how many records are involved, when the problem began, and whether it is still happening. Use the route you can verify fastest. If your edition supports report cross filters, run a Cases report filtered to closures since Friday afternoon, then use Cases without Activities with a subfilter that identifies the expected follow-up task by its
Subjector another reliable marker. If you are quicker with SOQL, retrieve the closed Cases and matching tasks for the same period, then compare their case IDs. Salesforce documents the editions and permissions that support report cross filters. At 9:00am, either route identifies 47 cases closed from Friday 4:30pm onwards without the expected task, including two closed this morning. The problem is still happening, and it is confined to one team’s process rather than the whole org. That last point decides how loudly to communicate. -
Find the most relevant recent change. Open Setup Audit Trail. Friday, 3:52pm: another admin activated a new version of the case follow-up flow. That is not proof, but it is the strongest lead you will get in a morning, and it arrived in one page.
Then open Paused and Failed Flow Interviews and select All Failed Flow Interviews. By Monday, the saved interviews corresponding to closures from 4:30pm onwards show the same validation error on the Create Records element. Open the new and previous flow versions side by side. Three differences matter:
- Execution path: task creation moved from the immediate path to Run Asynchronously.
- Field mapping: a new value is rejected by an existing Task validation rule.
- Error handling: the rebuilt Create Records element has no fault connector.
Together, those changes explain the symptom: task creation fails unhandled in a later transaction, after the case has closed. The org uses the default flow error-email recipient, so the messages went to the admin who last modified and activated this version. They had finished for the day before the first failure and are now on leave, so the messages have gone unread. The audit entry, interviews, version comparison, and messages now give you the change, the failure window, and the element that fails.
-
Contain the incident and verify the result. At 9:05am, reactivate the previous flow version. An interview already running continues on the version it started with, and an after-commit path can retry an unhandled failure after 15, 30, 60, and 120 minutes. Record those retry windows so you account for them during recovery rather than assuming the rollback cancelled every run from the faulty version.
Ask the team lead to close one representative case, then confirm that the follow-up task exists. At 9:12am, that check passes and you can record the incident as contained. The rollback does not create the 47 missing tasks; that is follow-up work. Containment is the cheapest safe action that stops things getting worse, and it is worth deciding separately from the permanent fix. Testing Configuration Changes turns this into a rollback trigger you write before a release, so the decision is already made by the time you need it.
-
Assign one incident owner. Record yourself, the on-call Salesforce admin, as the owner until the incident is closed. You are already talking to the team lead and made the containment decision, so you are responsible for seeing the follow-ups through. The admin who changed the flow can own the root-cause fix on return, but the incident ownership does not transfer. One accountable owner prevents everybody from assuming somebody else is watching.
-
Record and assign the follow-up. Add each action, owner, and deadline to the incident record.
- You, before midday: either wait for affected runs to reach their final failed state before backfilling, or make the backfill check each case for the expected task before it creates one. Then recreate the 47 missing tasks.
- The automation owner, by Tuesday 3pm: correct the field mapping, restore the fault path, and test the change in a sandbox with the support lead. They must also document why task creation needs a separate transaction; if there is no reason, it stays on the immediate path used by the earlier working version.
- You, after containment: change Process Automation Settings to send flow errors to Apex Exception Email Recipients, then add a restricted shared address on the Apex Exception Email page.
The error destination is org-wide rather than a setting for one flow, and the address will also receive Apex exception emails. Flow error messages can include user-entered data, so limit access to the shared inbox to the people who investigate them.
-
Communicate and close. Tell the team lead what happened, what has been contained, what remains outstanding, and when the next update will arrive. Close the incident only after:
- all missing tasks have been recreated without duplicates;
- the corrected flow has passed its agreed tests and been reactivated;
- the support lead has confirmed the result; and
- no new failures have appeared during the agreed 30-minute observation window.
Adoption, Training & Support covers the support route that carries this work into a backlog rather than a private message thread.
The completed record is short enough to scan during a handover:
| Field | This incident |
|---|---|
| Symptom | Cases close successfully, but the expected follow-up tasks do not appear and users receive no error |
| Scope | 47 cases closed from Fri 4:30pm onwards without the expected task at 9:00am Mon, including two this morning. Support team only; still occurring |
| Recent change | Case follow-up flow activated Fri 3:52pm Task creation moved to Run Asynchronously; its new field value fails a Task validation rule; Create Records has no fault connector Error emails went to one modifier’s inbox and remained unread |
| Containment | Previous flow reactivated Mon 9:05am; a test case created its task at 9:12am. Faulty-version retry windows recorded; 47 tasks still need recovery |
| Owner | On-call Salesforce admin until closure; automation owner owns the root-cause fix |
| Follow-up | On-call admin: check each case before backfilling its task, configure shared error routing, and update the team lead by midday Automation owner: correct and test the flow with the support lead by Tue 3pm Close after successful reactivation, stakeholder confirmation, and 30 minutes without failures |
🧠 Final Thoughts
Section titled “🧠 Final Thoughts”This article walked through the signals your org gives you every day: security baselines, Org Check, Setup Audit Trail, field history, login and user monitoring, storage and limits, scheduled and Apex jobs, flow and automation errors, and Salesforce Trust for the moments when something breaks outside your control. None of these are exotic tools. They are the everyday instruments that tell you how the platform is really behaving.
Org health is not a single tool or a once-a-year activity. It is a habit. If you keep two things from this chapter, keep the cadence table and the incident record: one makes sure somebody is looking, the other decides what happens when they find something. The more familiar you are with these signals, the faster you can spot drift, diagnose issues, and keep things running smoothly. The tools in this chapter give you the visibility to stay ahead of problems rather than reacting to them.
Build a rhythm of checking them regularly and the payoff compounds: fewer surprises, quicker diagnosis when something does go wrong, and an org you can trust as the foundation for everything else you build on it. That trust is what frees you to move quickly on the work that follows, instead of constantly firefighting the basics.
🚀 Next steps
Section titled “🚀 Next steps”A healthy org is also the foundation for everything that follows in this module. Now let’s continue with Advanced Salesforce UI Customisation, where you will shape Lightning apps, record pages, and the day‑to‑day experience users actually work in.